
Here is our March Market Snapshot, let’s unpack what this means and cover the two things you should pay attention to as we head into the spring/summer “selling season” for residential real estate.
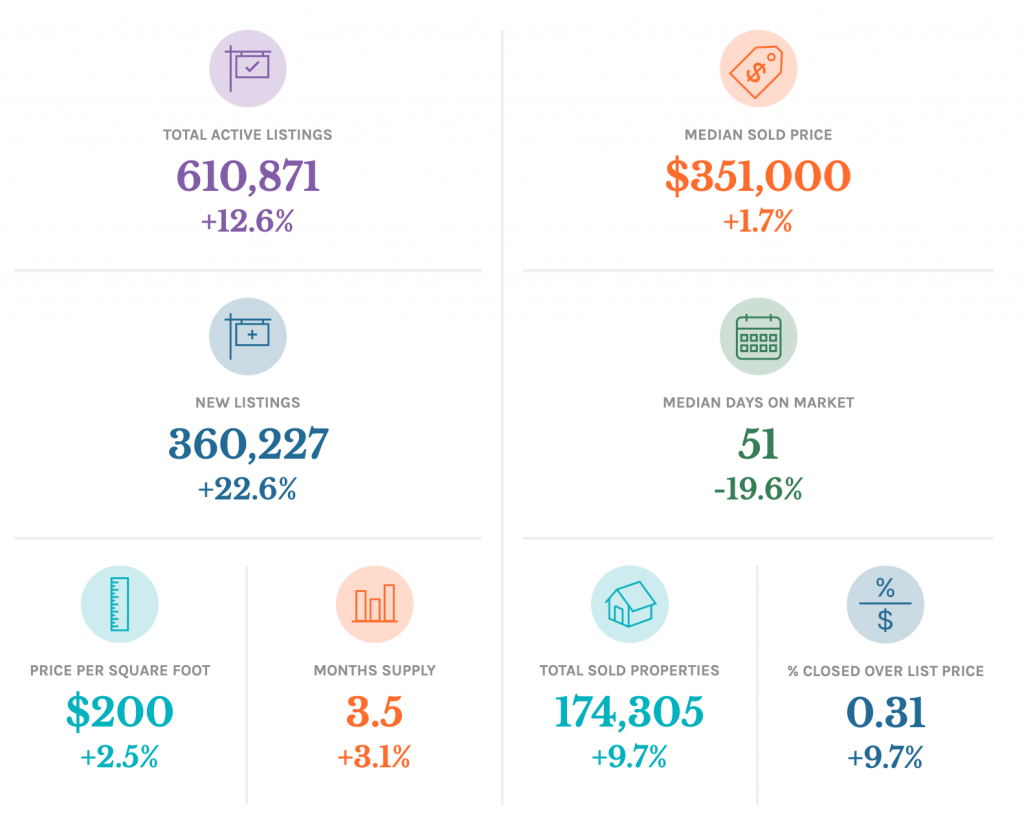
Let’s start with the two numbers to pay attention to, which are correlated: Total Active Listings and Months Supply. These data points represent two things: the total number of homes for sale (up 12.6%) and the months supply (up just over three percent). This could be (finally) the increase in inventory we’ve been waiting for, but you don’t want to take one data point and call it a trend. At least we’re finally seeing more inventory come on the market.
Usually, what we see this time of year is inventory levels start to rise as we enter the spring selling season. We usually see more listings coming on the market in preparation for the buyer demand, Now we’re finally seeing this in 2023 but it’s delayed… what gives? A few things:
- Interest Rates: it’s gotten a little harder for a seller to trade up when their current rate could be sub three percent and their new rate will be over six percent. It doesn’t mean they don’t want to, or that they won’t, it’s just gotten a little hard for them on the affordability side.
- Media: you’re hearing things like “home prices are down” or “real estate is poised for a slump” and buyers activity is the leading indicator. However, the buyer is back, looking for, writing offers on, and putting homes into contract – they lead the parade. Sellers haven’t gotten the memo yet that buyers are back since the national headlines don’t move in real time, in fact, they tend to trend three to six months behind reality. That is the critical reason to talk to a local real estate professional to get the real-time information.
- Early Stage: we’re very early in the spring selling season. There is a possibility that this is just a delayed effect so we should pay attention to these numbers in the coming weeks/months to see the trend line.
There is one other chart I am paying a lot of attention to other than the inventory side we’ve discussed above, and that is interest rates. Here is the chart thanks to Altos Research.
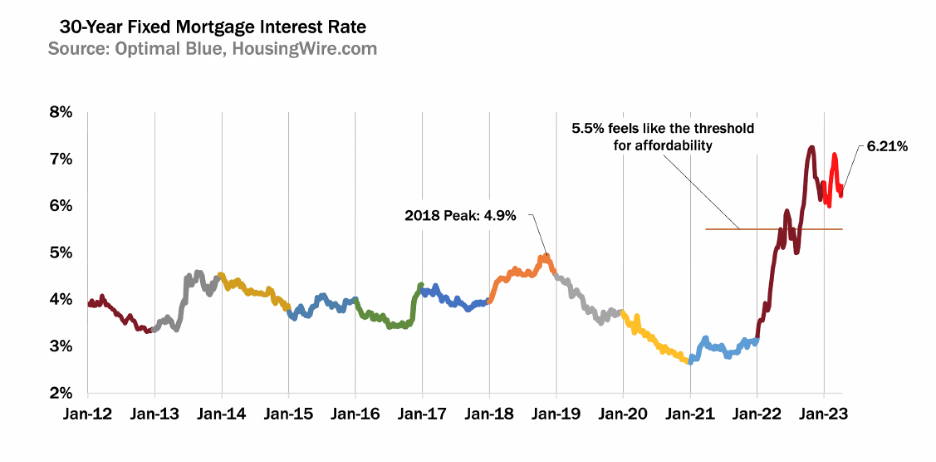
Two things of note:
Unprecedented Spike in 2022: you can see the parabolic rate rise in 2022. In my 20-plus years of paying attention to these kinds of things, I have never seen anything like this. As we have discussed before, the pace of change was so fast that buyers for sure (and sellers as well) just decided to hit the pause button on the big housing decision.
The Importance of Rates: you can see at the tail end of the chart the rates have been bouncing between six and sevent percent, and the key affordability trigger is somewhere around five and a half percent. Thanks to the banking crisis of a few weeks ago (odd way to say that), we’ve seen rates come down off the peak getting near seven percent (again). So long as we can keep rates between five and a half and six percent, the market has said buyers can handle that. They’re ok with that rate range and are willing to get back into the market place. When they get near seven percent, they back away and the closer they get to five and a half percent, the more buyers come back into the marketplace. So the key will be that we see rates stay steady (or even trend down) going into spring/summer.
Here is the summary (bet you wish I started with that to save you all the reading): if rates can stay between five and a half and six percent, buyers will stay in the marketplace through the spring. This will give time for sellers to catch on (maybe starting now?) to where we are and come into the marketplace more normally in the summer. My prediction is that we will see a lower than average number of homes sold this year. The number of homes sold will beat almost everyone’s expectations for 2023.