
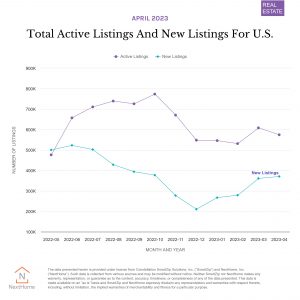
This month we’re only going to look at one chart that I think will tell a lot of the story of today’s real estate market.
As you can see, active inventory has started trending down, and at the same time, the number of new listings is trending up. How is that even possible? If you have more and more new listings coming on the market month after month, and a big uptick in March, how in the heck can overall inventory be down?
The answer is this: the buyer of residential real estate is back in action and in a big way. While there are new properties coming on the market, they’re being acquired at a higher pace than they’re being added. That is how you get the phenomenon of more new listings for several months but lower actual overall inventory.
The buyer is back and demand is high. In some markets really high for property and there simply are not enough listings for them to buy, so things are getting snapped up as they come on the market.
Don’t let any of these real estate headlines confuse you. The buyer is back. The question is, will the sellers continue to come back into the market as they have been since March and if so, will they come back at a faster pace? That is worth paying attention to.